
- Mu Hat exists to bring academic asset-pricing research into real-world portfolio management; its name captures the central challenge of investing: estimating expected returns that cannot be directly observed.
- Risk matters, but not all risk is rewarded. CAPM provides a useful starting point, while decades of research show that multiple systematic factors, not just market exposure, help explain differences in stock returns.
- Because factor leadership changes over time, Mu Hat uses proprietary machine-learning algorithms and high-performance computing to build a dynamic portfolio of 20 to 30 U.S. equities that we believe are positioned to outperform.
Introduction
The mission of Mu Hat is to bridge the gap between academic research and real-world investing. Our name comes from the notation academics use for an estimate of expected return. That symbol captures the central problem in investment management: expected returns cannot be observed directly, so investors must estimate them carefully using data, theory, and discipline. This memo explains the intuition behind that name, how it shapes our investment process, and how the strategy has performed in its early history.
Expected Excess Returns
When making an investment decision, investors should consider both the amount of risk they are taking and the excess return they expect to earn for bearing it. We define excess return as the difference between the payoff of a risky asset and that of a riskless one, such as a U.S. Treasury bill. For example, consider the equity risk premium (ERP), the difference between the expected return of the stock market and the risk-free rate. In 2025, the S&P 500 returned nearly 18%, while the one-year Treasury bill returned approximately 4%, delivering an ERP of 14%. Insofar as investors expect the same returns for 2026, this means that investors expect to earn an additional 14 percentage points for bearing the risk of investing in the stock market instead of a risk-free asset.
When measuring volatility, or risk, of an asset, we separate it into systematic and idiosyncratic components. This distinction matters because markets do not compensate all risk equally. Systematic risk is the portion that moves with the broader market, while idiosyncratic risk is specific to an individual company and, in a diversified portfolio, can largely be diversified away. Investors are generally only compensated for bearing systematic risk, and factor models are the standard tool for measuring that exposure.
A canonical model of the interplay between asset returns and risk is the Capital Asset Pricing Model (CAPM). This model says that the expected excess return of asset i is proportional to the equity risk premium. Mathematically, we can express this as:
(1)
where firm-specific tells us how much we should expect stock i to change given approximately a 1% change in the equity risk premium (ERP). To economize notation, we often write the above equation in shorthand by denoting expected returns as (pronounced “myew”) and our chosen risk factor, the market risk premium, as (pronounced “lambda”),
(2)
However, equation (2) is a statement about true but unobservable expected returns. In practice, we must estimate expected returns from historical data. To distinguish our estimates from those of the model, we place a hat over them. Our estimate of a stock’s expected return is therefore “mu hat” — Mu Hat. Different data, models, and estimation methods will yield different estimates of expected returns, and the quality of those estimates determines the success of our investment decisions.
The equity risk premium is unobservable, but there exist several models and estimation techniques for measuring it with historical data. For more information on these models, see our blog On Time-varying Risk Premia.
Our Approach
While the CAPM is elegant, decades of empirical research have shown that it does not fully explain the cross-section of stock returns. In plain English, market exposure is not the only systematic force that matters. Researchers have documented a variety of additional factors associated with expected returns, including size, value, momentum, profitability, and investment behavior, among others.
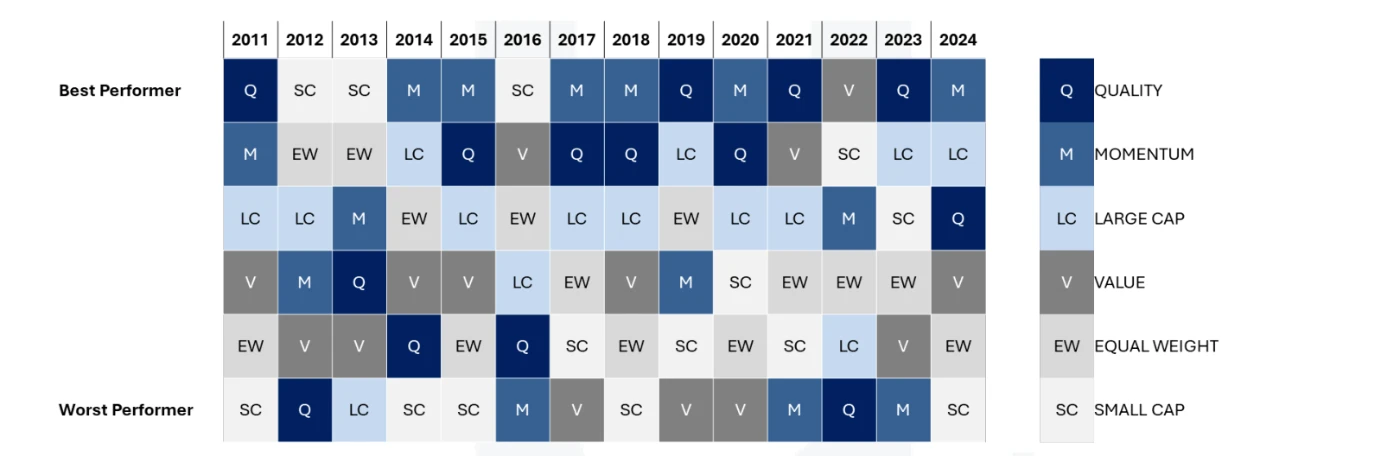
Figure 1 shows the year-by-year ranking of different factors or styles often used by portfolio managers. It makes one point especially clear: leadership rotates. Value, momentum, quality, size, and other styles each experience periods of relative strength and weakness. No single factor outperforms in every environment. The practical challenge is not simply identifying factors in retrospect; it is determining which factors matter now, how they interact, and how to build a portfolio around them in a disciplined way.
At Mu Hat, we approach these questions quantitatively. We begin with financial statement and stock price data for U.S.-domiciled firms dating back to 1963. From those raw data, we build a database of thousands of signals that prior research has linked to expected returns.
We then let the data speak. Rather than imposing strong a priori views about which factors must matter, we use high-performance computing and custom machine-learning algorithms to identify the most relevant characteristics and their relationships with risk-adjusted returns. This approach helps us capture complex, non-linear patterns and adapt as market conditions change.
We then combine those signals into a single meta-factor model and use that model to construct a diversified portfolio of 20 to 30 stocks that we believe are positioned to outperform. As new information arrives and the market reacts, we update the data, re-estimate our models, and repeat the process. Our flagship fund, Hound Dog Fund, LP (“Hound Dog”), provides our partners access to methods that have historically only been available to large institutional investors.
John Cochrane, in his 2011 American Finance Association Presidential Address, coined the phrase “factor zoo” to describe the proliferation of potential asset-pricing factors.
Our Results
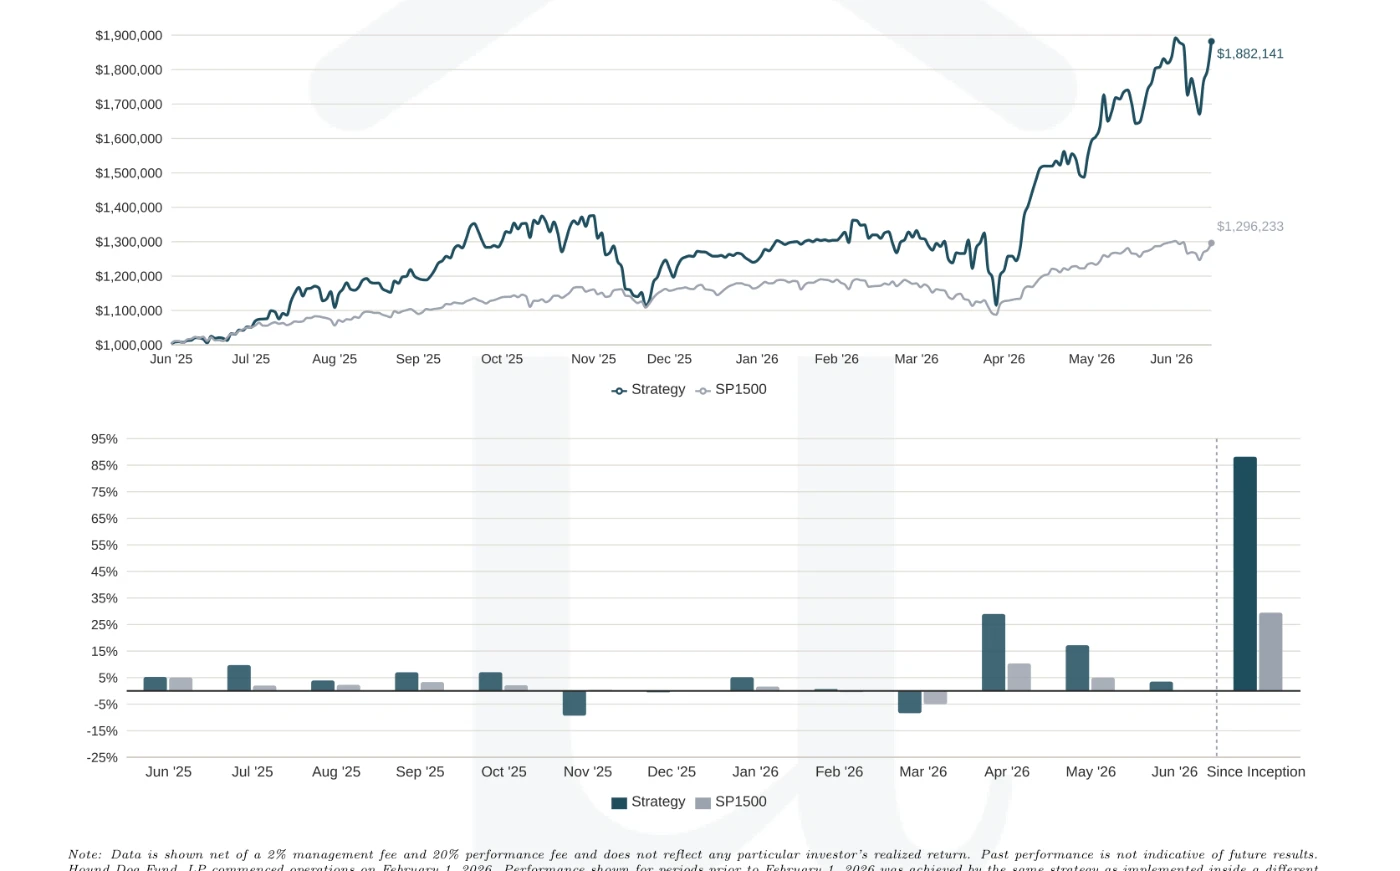
Figure 2 shows the performance of our strategy since inception. Our first year has been promising. Net of a 2% management fee and a 20% performance fee, our strategy has returned nearly 85%. For additional context, the S&P 500 returned approximately 26% over the same period.
At Mu Hat, we are committed to transparency, and this commitment is reflected in how we operate. We make performance available daily on our website; and because our investments are in liquid securities, we do not impose any lock-up, minimum investment period, or other withdrawal restrictions. We welcome any questions or feedback you may have, as we believe that open communication is key to building trust and fostering long-term relationships with our investors.
Disclosures
Informational use only. This document is provided solely for informational purposes and does not constitute an offer to sell or a solicitation of an offer to buy interests in Hound Dog Fund, LP, or any other security. Any offer may be made only through definitive offering documents, which contain important information about investment terms, risk factors, conflicts of interest, fees, and expenses.
No advice or recommendation. Nothing contained herein should be construed as investment, legal, tax, accounting, or other professional advice, or as a recommendation to buy, sell, or hold any security or investment strategy. Prospective investors should consult their own advisers and review the relevant offering documents before making any investment decision.
Performance and risk. Past performance is not indicative of future results. There can be no assurance that the strategy will achieve its objectives, achieve profits, or avoid losses. Investment return and principal value may fluctuate, and an investor may lose all or a substantial portion of the capital invested.
Strategy and investor-level performance. Performance information shown represents the Hound Dog strategy and does not reflect any particular investor’s realized return. Individual investor returns may vary materially based on subscription dates, withdrawals, capital activity, expenses, side letters, and other investor-specific factors. Unless otherwise stated, performance is presented as a time-weighted total return of the Hound Dog investment strategy and is intended to measure the performance of the strategy independent of individual investor cash flows. Time-weighted strategy performance differs from investor-level performance. Actual investor returns are affected by each investor’s subscription date, withdrawal date, capital account balance, applicable fee arrangement, performance allocation, expense allocation, and other individual circumstances. Current investors should refer to their official capital account statements and fund reports for investor-specific performance.
Fees. Unless otherwise stated, performance is shown net of the Fund’s 2% management fee and 20% performance fee.
Predecessor or pre-fund performance. To the extent performance includes periods before Hound Dog Fund, LP commenced operations or before a particular investor entered the fund, those results reflect the same underlying investment strategy in a different vehicle or account and should not be interpreted as that investor’s actual return. Hound Dog Fund, LP commenced operations on February 1, 2026. Performance shown for periods prior to February 1, 2026 was achieved by the same strategy as implemented inside individual accounts. Hound Dog Fund, LP did not exist during the pre-February 1, 2026 period, and no investor in Hound Dog Fund, LP received the returns shown for that period through Hound Dog Fund, LP. The pre-Hound Dog results are included because Mu Hat believes they are relevant to understanding the historical performance of the strategy, but they should be evaluated in light of the fact that the strategy was implemented in a different investment vehicle before Hound Dog Fund, LP commenced operations. The pre-Hound Dog performance is included only because the investment strategy, investment objective, portfolio construction process, and principal decision-making responsibility are believed to be substantially similar to the strategy currently implemented for Hound Dog Fund, LP. To the extent there were differences in vehicle structure, fee arrangements, expenses, account size, tax treatment, liquidity terms, cash flows, or operational constraints, those differences may cause Hound Dog Fund, LP’s results to differ from the pre-Hound Dog results.
Benchmark and index comparisons. Any benchmark or index comparison is provided for context only. Benchmarks are unmanaged, do not reflect private-fund fees, expenses, or trading costs, and cannot be invested in directly. The strategy may differ materially from any benchmark in concentration, turnover, exposures, volatility, and risk.
Hypothetical or backtested information. To the extent any hypothetical, backtested, model, target, or projected information is included, it has inherent limitations, may be prepared with the benefit of hindsight, and should not be considered indicative of actual trading results or future performance.
Sources and forward-looking statements. Information has been obtained from sources believed to be reliable, but Mu Hat Capital Management, LLC makes no representation or warranty as to its accuracy, completeness, or timeliness. This document may include estimates, projections, targets, or other forward-looking statements. Actual results may differ materially from those expressed or implied.
Suitability, liquidity, and confidentiality. Interests in private investment funds are suitable only for certain financially sophisticated investors who satisfy applicable eligibility requirements, have no need for immediate liquidity, and can bear the risks of a private fund investment for an extended period. This document contains confidential and proprietary information and should not be reproduced or redistributed without prior written consent.