
Our strategy is designed to pursue outsized returns, which means the path will not look smooth every month. That is the nature of a high-conviction, high-octane approach: the return stream can be noisy, even when long-term compounding is attractive. For investors, the right question is not whether volatility will appear, but what that volatility actually means, how to interpret it, and what history suggests tends to happen after periods of stress.
- Volatility is the range of outcomes, not a verdict on long-term value creation.
- The VIX is the market’s 30-day implied volatility gauge for the S&P 500; it says more about the expected size of moves than their direction.
- In the 3- and 6-month periods following spikes in the VIX, our strategy returned an average of 32.5% and 59.2%, respectively.
Volatility, defined
Volatility is the dispersion of returns around their average. In practical terms, it is what makes a portfolio feel smooth or bumpy from one month to the next. Higher volatility means a wider spread between good months and bad months, deeper interim drawdowns, and a less linear path of compounding. Importantly, volatility is not the same thing as a permanent capital loss. A portfolio can be volatile and still create substantial value if its positive months ultimately outweigh its setbacks.
What volatility means for a portfolio
For a broad diversified portfolio with low turnover, volatility, and return, is often muted. For an opportunistic strategy, it is usually higher because the strategy is trying to capture a specific opportunity set. That trade-off matters. Higher volatility can test patience and shorten the time horizon of the unprepared investor, but it can also be the price paid for access to materially better upside. In other words, volatility is path risk: it changes the ride, even when the destination is attractive.
Where the VIX fits
The VIX, or CBOE Volatility Index, measures the market’s expected 30-day volatility for the S&P 500. It is often called a fear gauge because it tends to rise when investors are paying more for near-term downside protection. The key point is that the VIX does not predict direction. A high VIX says the market expects larger moves; it does not tell us whether those moves will be up or down. For active managers, that distinction matters: high-VIX environments can feel uncomfortable in real time, but they can also create mispricings and better forward opportunity sets.
How our strategy has behaved after volatility spikes
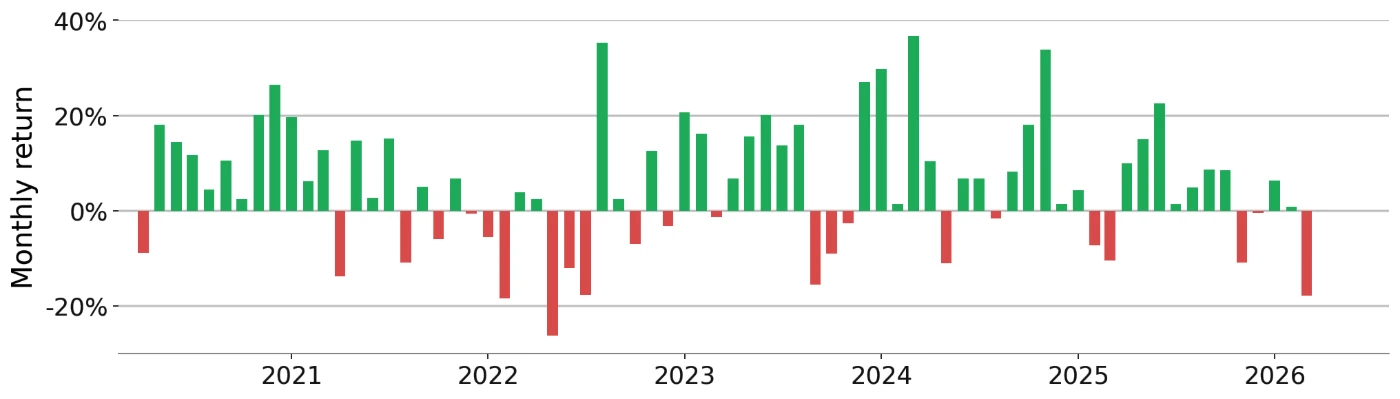
Our own history reinforces that framework. Our strategy has undeniably experienced large monthly swings, as Figure 1 shows, but the bigger message is the compounding profile and what tends to happen after volatility shocks. Using VIX spike episodes as a simple marker of market stress, the subsequent three and six months were positive in every episode across the period reviewed.
To make the point concrete, we paired the charted monthly return history with VIX spike windows, defined as contiguous months in which the monthly VIX high exceeded 30. Figure 1 below shows the path; Table 1 looks forward from the end of each episode.
| Episode | Peak VIX | Next 3M | Next 6M |
|---|---|---|---|
| Apr 2020–Jul 2020 | 60.6 | +18.4% | +115.2% |
| Sep 2020–Mar 2021 | 41.2 | +1.5% | +9.5% |
| Dec 2021–Jun 2022 | 38.9 | +14.1% | +15.5% |
| Sep 2022–Oct 2022 | 34.9 | +31.3% | +60.9% |
| Mar 2023 | 30.8 | +48.3% | +68.4% |
| Aug 2024 | 65.7 | +71.0% | +67.9% |
| Apr 2025 | 60.1 | +43.2% | +77.0% |
| Mar 2026 | 35.3 | — | — |
Methodology: VIX spike episodes are contiguous months in which the monthly VIX high exceeded 30. Forward returns are measured cumulatively over the next three and six months after the episode ends. Past performance is not a guarantee of future results.
Across the eight VIX-spike episodes identified, seven have fully observable three-month and six-month forward windows. In every observable case, the subsequent return was positive. The strategy has certainly experienced meaningful month-to-month variation, but the periods of elevated market stress identified have historically been favorable entry points for subsequent performance. Average forward returns were 32.5% over the next three months and 59.2% over the next six months. Past performance does not guarantee future results, but the pattern is consistent with how we expect the strategy to behave: dislocations can create the raw materials for the next leg of returns.
Disclosures
The information set forth herein has been obtained or derived from sources believed by Mu Hat, LLC (“Mu Hat”) to be reliable. However, Mu Hat does not make any representation or warranty, express or implied, as to the information’s accuracy or completeness, nor does Mu Hat recommend that the attached information serve as the basis of any investment decision. This document has been provided to you solely for information purposes and does not constitute an offer or solicitation of an offer, or any advice or recommendation, to purchase any securities or other financial instruments, and may not be construed as such. This document is intended exclusively for the use of the person to whom it has been delivered by Mu Hat and it is not to be reproduced or redistributed to any other person. Past performance is not a guarantee of future performance.
This presentation is not research and should not be treated as research. This presentation does not represent valuation judgments with respect to any financial instrument, issuer, security or sector that may be described or referenced herein and does not represent a formal or official view of Mu Hat.
The views expressed reflect the current views as of the date hereof and neither the speaker nor Mu Hat undertakes to advise you of any changes in the views expressed herein. It should not be assumed that the speaker or Mu Hat will make investment recommendations in the future that are consistent with the views expressed herein, or use any or all of the techniques or methods of analysis described herein in managing client accounts. Mu Hat and its affiliates may have positions (long or short) or engage in securities transactions that are not consistent with the information and views expressed in this presentation.
The information contained herein is only as current as of the date indicated, and may be superseded by subsequent market events or for other reasons. Charts and graphs provided herein are for illustrative purposes only. The information in this presentation has been developed internally and/or obtained from sources believed to be reliable; however, neither Mu Hat nor the speaker guarantees the accuracy, adequacy or completeness of such information. Nothing contained herein constitutes investment, legal, tax or other advice nor is it to be relied on in making an investment or other decision.
There can be no assurance that an investment strategy will be successful. Historic market trends are not reliable indicators of actual future market behavior or future performance of any particular investment which may differ materially, and should not be relied upon as such. Target allocations contained herein are subject to change. There is no assurance that the target allocations will be achieved, and actual allocations may be significantly different than that shown here. This presentation should not be viewed as a current or past recommendation or a solicitation of an offer to buy or sell any securities or to adopt any investment strategy.
The information in this presentation may contain projections or other forward-looking statements regarding future events, targets, forecasts or expectations regarding the strategies described herein, and is only current as of the date indicated. There is no assurance that such events or targets will be achieved, and may be significantly different from that shown here. The information in this presentation, including statements concerning financial market trends, is based on current market conditions, which will fluctuate and may be superseded by subsequent market events or for other reasons. Performance of all cited indices is calculated on a total return basis with dividends reinvested.
The performance results included in this presentation are hypothetical returns which have been compiled by Mu Hat. The performance results are based upon a hypothetical model. Hypothetical performance results may have inherent limitations, some of which are described below. No representation is being made that any account will or is likely to achieve profits or losses similar to those shown. One of the limitations of hypothetical performance results is that they are prepared with the benefit of hindsight. There are numerous other factors related to the markets in general or to the implementation of any specific trading strategy which cannot be fully accounted for in the preparation of hypothetical performance results and all of which can adversely affect actual trading results. These returns should not be considered as indicative of the skills of the investment adviser.
Neither Mu Hat nor the speaker assumes any duty to, nor undertakes to update forward looking statements. No representation or warranty, express or implied, is made or given by or on behalf of Mu Hat, the speaker or any other person as to the accuracy and completeness or fairness of the information contained in this presentation, and no responsibility or liability is accepted for any such information. By accepting this presentation in its entirety, the recipient acknowledges its understanding and acceptance of the foregoing statement.
Fees: The performance information shown for Hound Dog Fund, LP (“Hound Dog”) is calculated net of fees and expenses. Specifically, the performance information shown is net of a management fee of 2% per annum and a quarterly incentive fee of 20% with a high-water mark clause. Past performance is not an indication of future performance and there can be no assurance that either Mu Hat or any of their respective underlying funds will meet their investment objectives or achieve results in line with those presented in these materials. The performance results are unaudited and subject to change.
Benchmark: The composite benchmark is the SPDR® Portfolio S&P 1500® Composite Stock Market ETF (the “Benchmark”). The Benchmark is an Index designed to measure the performance of the broad exchange-traded U.S. equity securities universe. The Index consists of those stocks included in the S&P 500® Index, the S&P MidCap 400® Index, and the S&P SmallCap 600® Index. Each underlying index includes U.S. common equities listed on the NYSE, NYSE Arca, NYSE American, NASDAQ Global Select Market, NASDAQ Global Market, NASDAQ Capital Market, Cboe BZX, Cboe BYX, Cboe EDGA, or Cboe EDGX that meet specific market capitalization requirements.
Past performance is not an indication of future performance.